Data Visualization with QGIS
- Time9.15 - 15.15
- Duration7,5 t
- Price4500 kr ekskl. moms (inkl. bidrag til QGIS)
- PlaceKøbenhavn
- TeacherKurt Menke
Course content
This course is a thorough introduction to the array of advanced techniques you can use within QGIS to create sophisticated cartography and beautiful maps. Learn how to create custom legend patch shapes and use cases for Blending modes and Layer effects. Learn to create beautiful elevation maps and coastal effects. Discover how to animate time based data, work with 3D views and create more custom cartography via expressions. If you want to learn the creative ways to render your geodata and create stunning maps, this course is for you.
In the course you will be learning about:
- Print layout tricks
- Configure label blocking map elements (e.g., title text or a legend)
- Legend patch shapes to create more intuitive legends
- Live layer effects (drop shadows, inner glows…)
- Rendering Elevation Data
- Hillshade renderer
- Contour renderer
- Blending Modes - These allow for more sophisticated rendering between GIS layers and there are 13 different blending modes available at both the layer and feature level. Here you will learn the most common use cases.
- Layer blending
- Multiply
- Overlay
- Feature blending
- Addition
- Layer blending
- Rendering Point Data - Learn how to effectively use the renderers specific to point data.
- Point cluster
- Heatmap
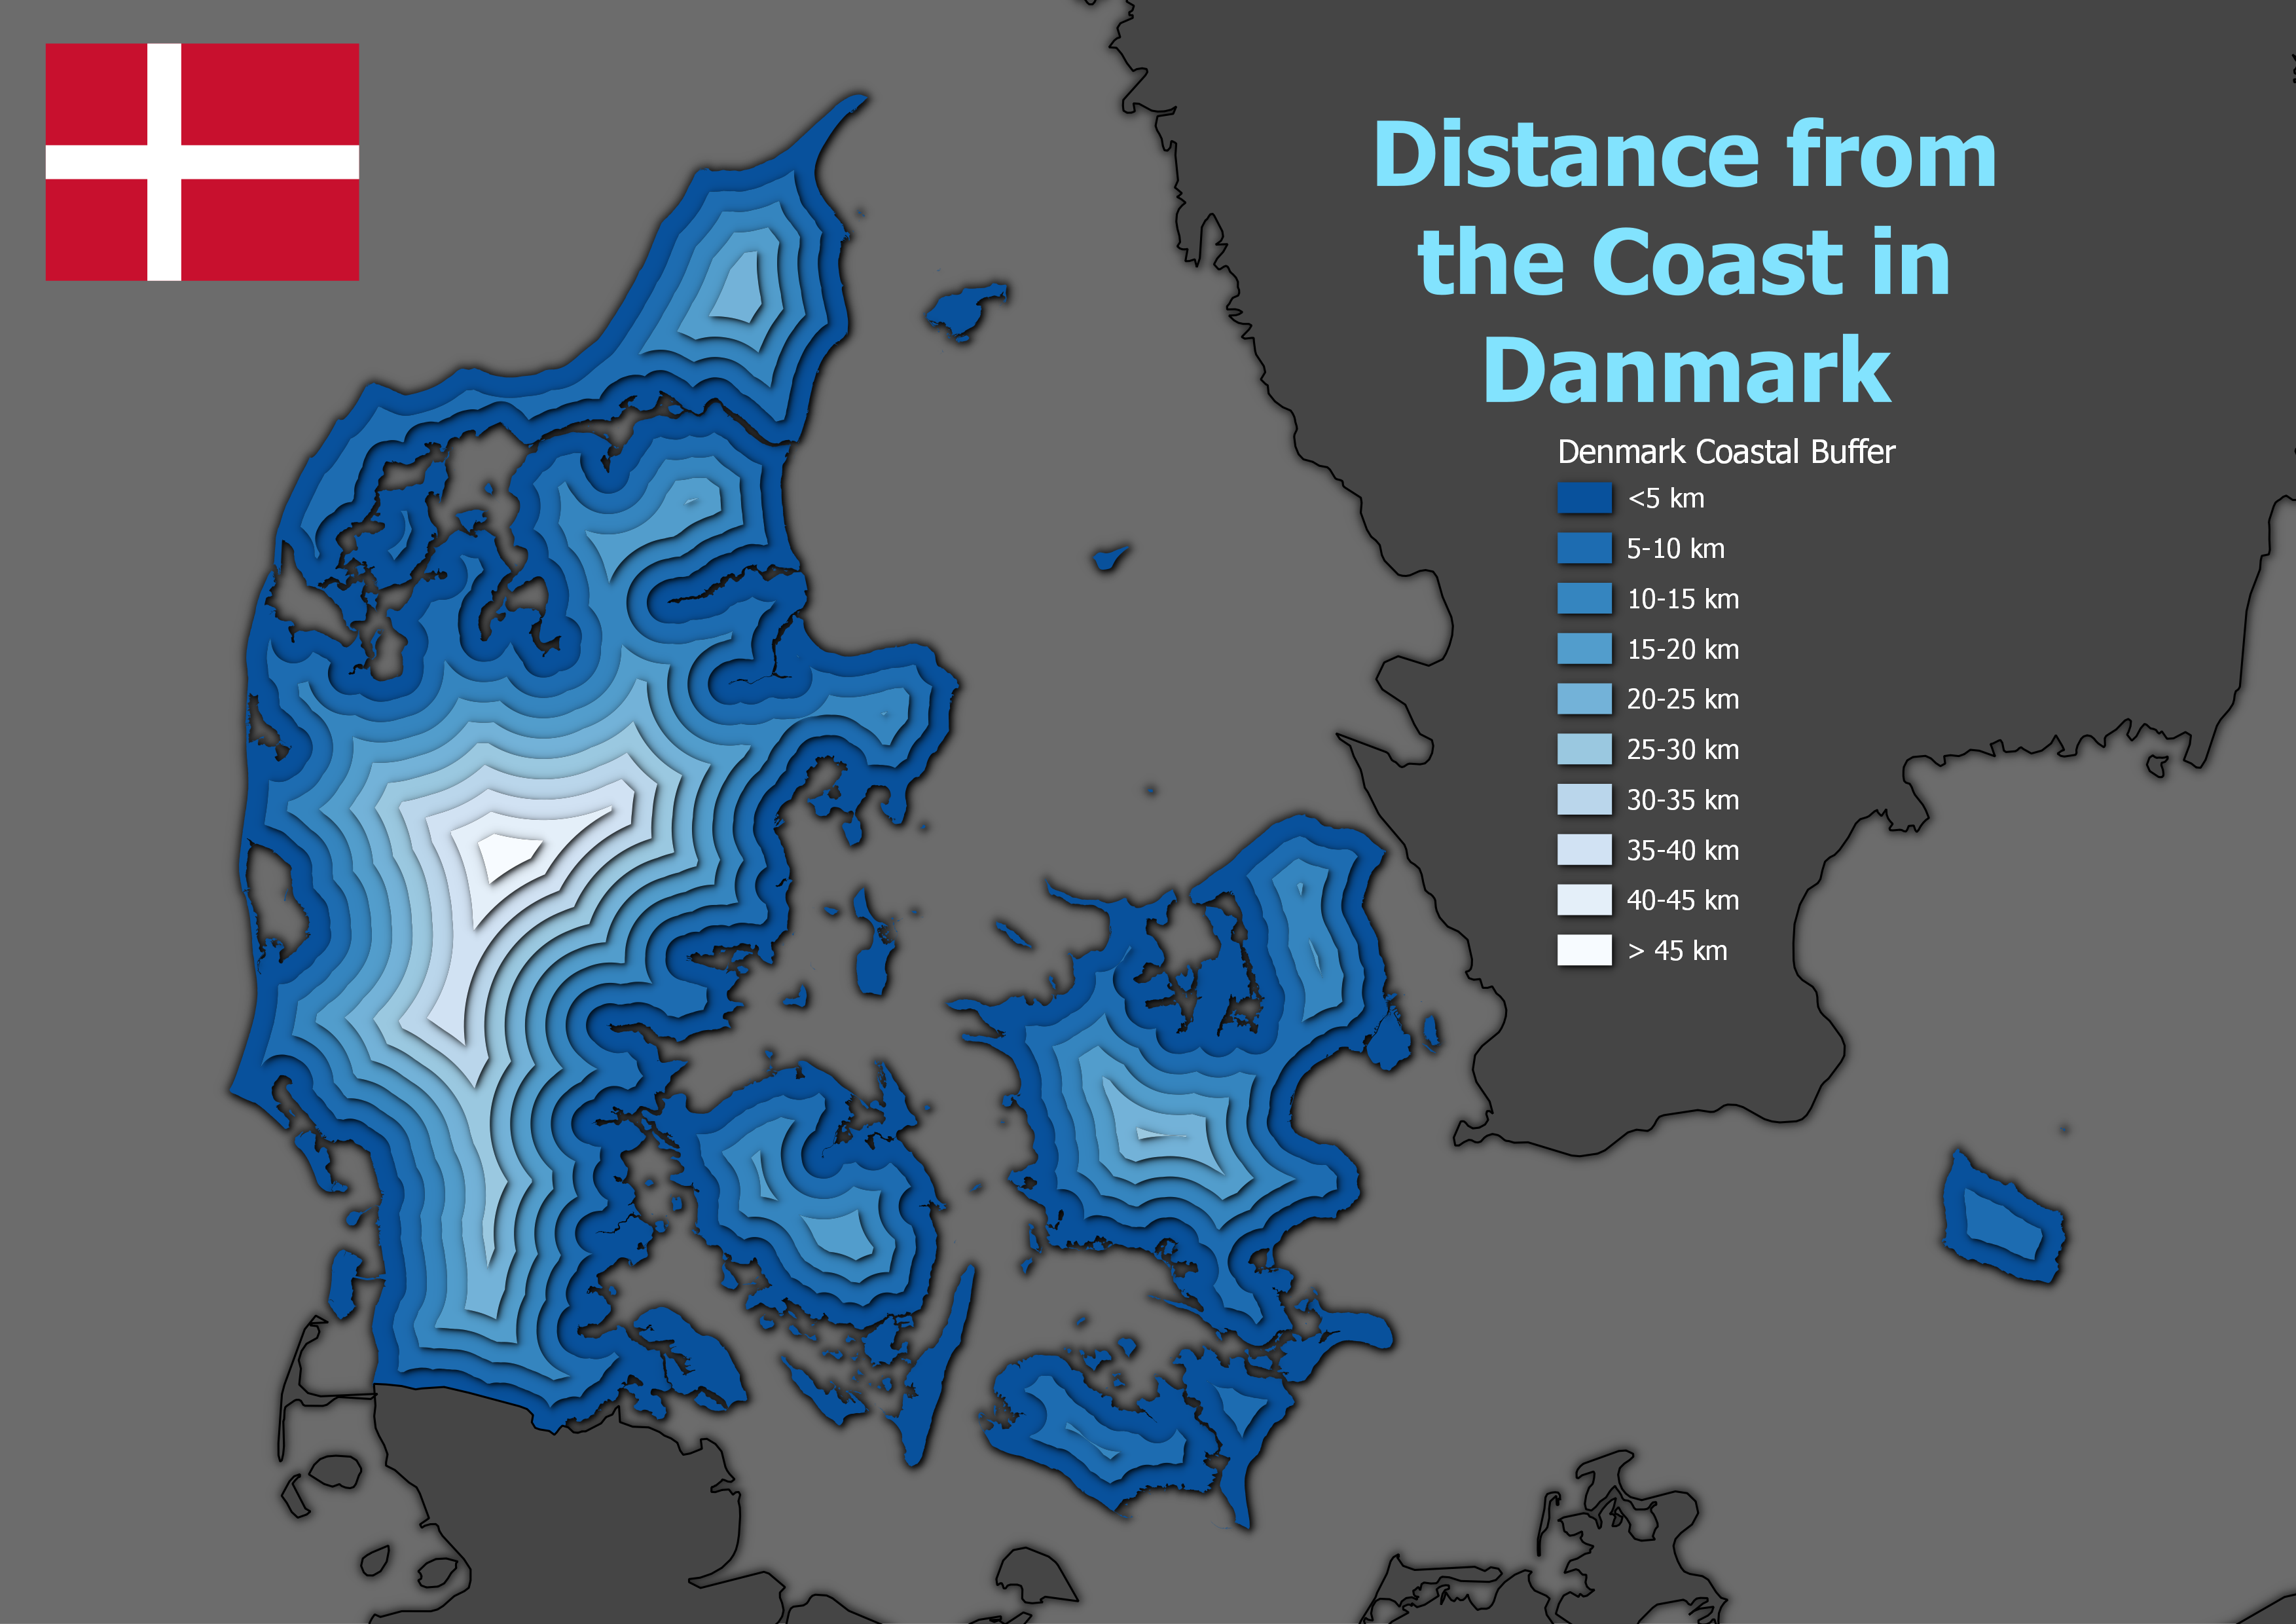
- Coastal Effects
- Coastal Vignette
- Ben-day dots
- Map photo points - using with data defined overrides and geometry generators.
- Temporal Controller - Learn to animate spatial data through time.
- 3D Views - Learn how to work with the native QGIS 3D Viewer
Course format
The course consists of:
- An introductory video
- Course day (6 hours)
- Independent task (expect about 2 hours to do this)
- Online follow-up session (1.5 hours)
Course price
4,500 kr.
Introductory video: One week before the course starts you will receive a link to the course website which will include a link to an introductory video with an introduction to the array of QGIS data visualization tools you will learn about.
Course day: This course takes place at our office in Copenhagen and consists of a mixture of demonstrations of data visualization techniques and short assignments, so that you get experience using the different tools and workflows.yourself.
You will also receive a step-by-step manual for with instructions for all the workflows covered. A course webpage will be provided with links to videos for each workflow. These will be valuable resources you can refer to after the course has ended.
Assignment: The course includes an independent assignment that you will work on after the course. It is an assignment where you get the opportunity to repeat some of the things you have learned on the course, so hopefully it sticks better. The assignment is voluntary but recommended to get the most out of the course. You should plan on setting aside 2 hours to complete the assignment, after the course and before the follow-up session.
Question/answer session: This will be held one week after the course session. It’s an opportunity to have a more informal discussion about any of the data visualization techniques we covered, the independent assignment or questions about your own datasets.
Course dates
The course takes place over two days:
- Course day (Copenhagen): 22/05 from 9.15 - 15.15
- Follow-up session (online): 04/06 from 13.00 - 14.30
QGIS certified course
The course is certified by the QGIS organization, which has approved the material and the course program. When you participate in this course, you contribute 20 euros to the continued development of QGIS. You will also receive an official QGIS certificate after completing the course.
Practical information
The course is held in English.
QGIS 3.34 is used for the course. You must ensure that you have access to a computer with this version of QGIS (or later version of QGIS) installed before the course. QGIS with either the Danish or English translation can be used.
Register before: 10 May 2024.
Contact Kurt kurt@septima.dk, if you want to hear more about the course.